Every agency would like to start the New Year with three targets firmly in mind, Growth, Productivity, and Profitability. Yet most will do so by the ‘seat of their pants’, wishing that 2018 will be better than 2017, but doing nothing constructive to realize that wish.
Did you know why the gold miners in California in the nineteenth century called themselves the “Forty-Niners”? James Wilson Marshall actually found gold at Sutter’s Mill in the American River at Colona, CA in JANUARY, 1848. But the people who read the news in the San Francisco papers simply didn’t believe the stories because there was not enough evidence of the find. Once the gold started flowing, the people came by the hundreds of thousands – but it took a full year before the “Forty-Niners” flocked to try their luck at gold panning.
What does gold panning in 1849 (or 1848) have to do with running an independent agency in the 21st Century? In both cases, commitments will not be made to do the most productive things until the participants know enough about the situation to determine what that right thing really is.
In 1848 the delays were caused by the lack of substantiation and evidence that there was gold in the river for the taking. Well there is GOLD in your agency for the taking and all you need to do is know where to “pan” or where to “dig”. You have the same problem as the skeptics in San Francisco in 1848. You are very aware of the market conditions and the effect it has had on your agency but you are not yet aware of how your agency can be ‘jump-started’ to enjoy the double-digit growth and double digit profits that are still enjoyed by a minority of agencies in the U.S. who know and capitalize on their strengths and know their weaknesses and work diligently to develop them.
How do you know your strengths and weaknesses? By driving empirical data from your agency activities and results, evaluating those activities and results according to a) your own history, b) agency averages such as Agency Consulting Group, Inc.’s Composite Group annual data sets, and c) the activities and results of the high performing agencies around the country (many of Agency Consulting Group, Inc.’s clients).
Here is just a few examples of things you should know about your own agency and how to analyze them. They come from Agency Consulting Group, Inc.’s GPP (Growth, Productivity, and Profitability) Analysis that we do at the initiation of every client relationship.
BOOK OF BUSINESS ANALYSIS
Do you write an (overall) profitable book of business across all companies? Are you generating an appropriate level of contingency on that business?
Pull out your last year-end Production and Loss reports from each company that you represent, or at least the companies that represent at least 80% of your premium writings. You will not be able to get them from E&S sources and might not get these reports routinely from smaller carriers. But the carriers with whom you are licensed as an agent has them available and should be sending them to you at least once each year.
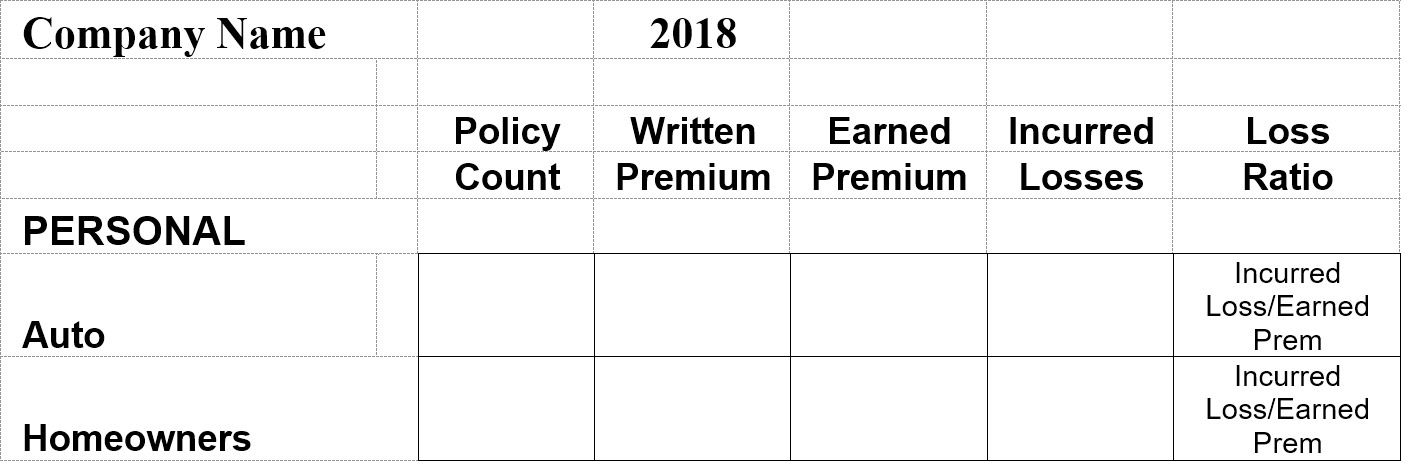
Create a spreadsheet that includes the primary Lines of Business (personal and commercial) with Written Premium, Earned Premium, and Incurred Losses for each line by carrier. It should look something like this:
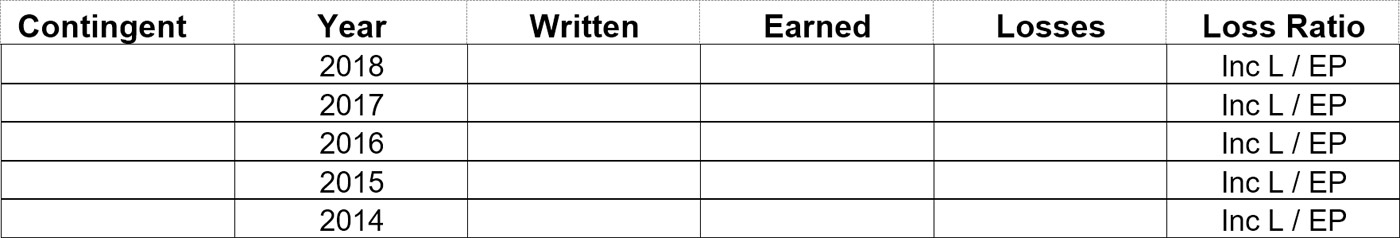
Also include a contingency history for each company. It should look like this:
Enter your appropriate information in the cells provided. Combine all companies’ information into a combined Line of Business Analysis for all common personal and commercial lines across all companies represented.
The result will be a line-by-line loss ratio FOR YOUR AGENCY instead of for a single carrier. If your loss ratio in any year was affected by one or two shock losses, you can footnote them and provide a loss ratio display both with and without the catastrophes.
This information will provide you, and any carriers that you are trying to attract, a complete picture of the quality of your underwriting over time. The Combined section at the top will show them your last year’s performance. The Combined section below will show them the historical performance of your agency and whether participation with their carrier can be beneficial to you as well as to the prospective carrier by calculation of their contingency in real time loss ratio and volume views.
TOP ACCOUNTS
Identify the Top Accounts in your agency by revenues (commissions and fees) generated from each. Depending on the complexion of your agency, these accounts might be $30,000 or $40,000 revenue accounts or more – or they may be $3,000 or $4,000 revenue or less. It doesn’t matter. What matters is to know how many accounts compile what part of your total commercial lines writings in order to determine your agency’s volatility. What happens if five accounts bring you 70% of your commissions and you lose two or more of them in one year? What happens if 25 accounts bring you 40% of your commissions and you lose two or three of them? It may hurt, but it will less likely put you out of business in the second example than in the first.
Your listing will likely look like this (there is no minimum or maximum number of accounts. The guideline is to use all accounts that generate over 1% of your commercial lines income as part of the list.
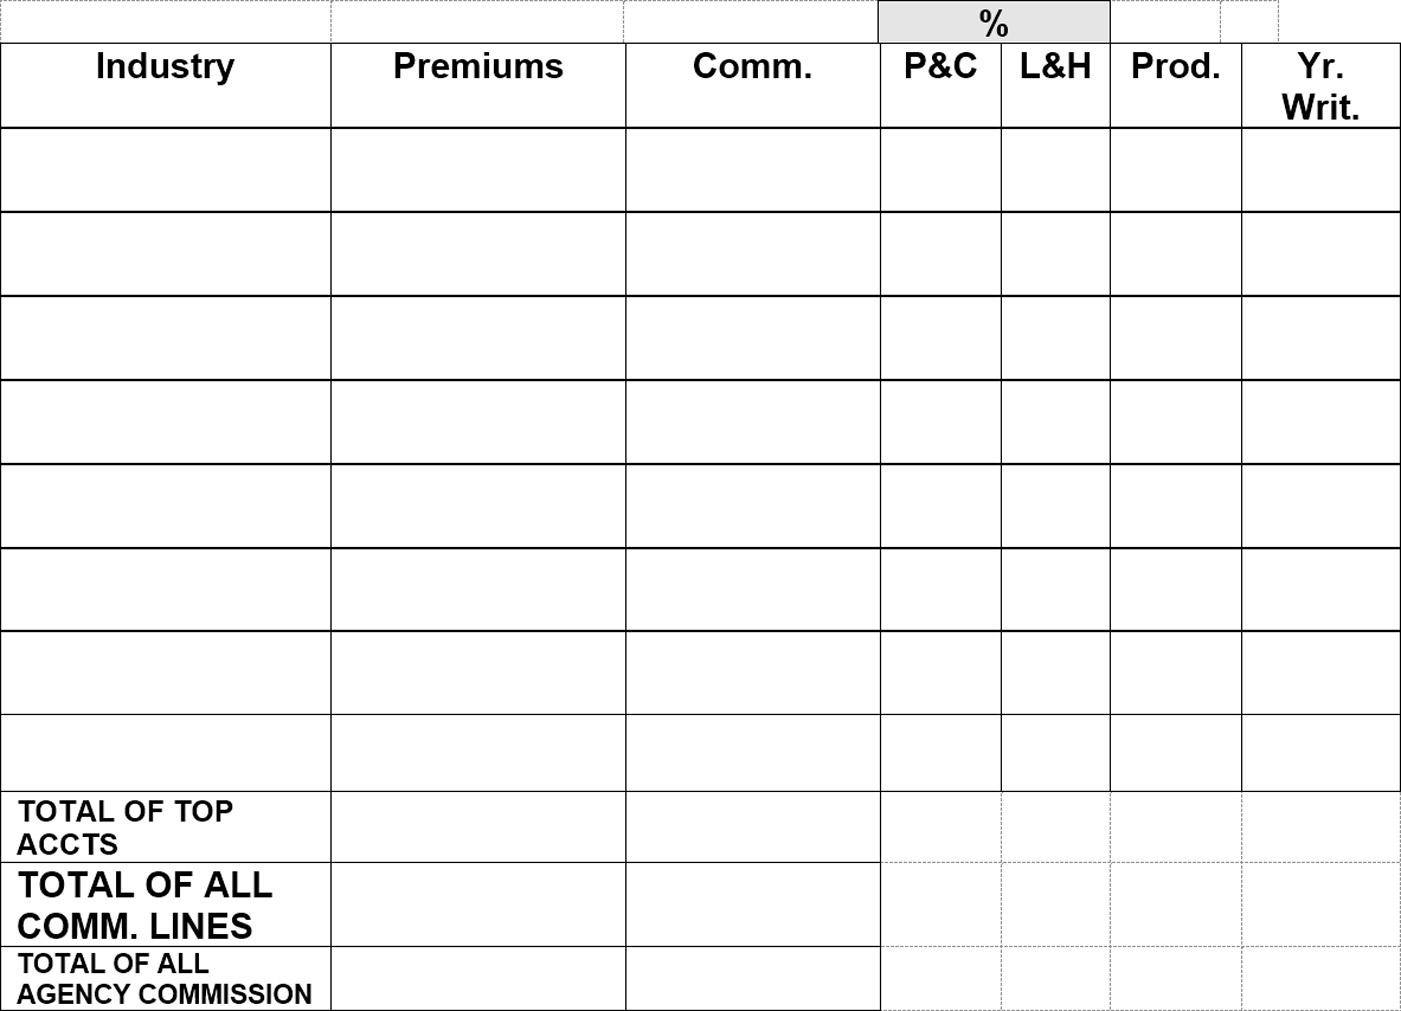
This information will tell you whether you are heavy in one or a few specific industries or are a generalist. It will give you specific information about your average size of accounts including and excluding your Top Accounts. It will tell you how much volatility you experience and permit you to market toward or away from accounts of specific sizes or industries in the next year.
These are only two of the 40 questions we ask in our GPP Analysis Questionnaire as we analyze our clients’ agencies and those of agencies that they wish to acquire or with which they desire to merge. Each question is designed to analyze another function of the agency’s administrative operation, financial condition or marketing expertise.
In our GPP Analysis, the results of these analytics are the recommendations that we make to enhance growth expectations, individual and agency productivity and agency profitability. We have done this continually since 1985, so we can learn in only a few days what some agents take years to understand about their businesses. That’s the benefit of hiring the ‘Pros’ to evaluate and enhance your performance. Many agents have found the GPP Analysis Questionnaire productive for them to use to gain a better insight into the operation of their own businesses. We would be happy to discuss the potential of a GPP Analysis with you or to send you a GPP Analysis Questionnaire for your use (at no cost, of course). Please call David Diamond, Marketing Director, Agency Consulting Group, Inc. at 800-779-2430.
Why not look to 2018 with a NEW ATTITUDE. Take control of your life and of your business in 2018 and do what you’ve been intending to do for years – call us and get started now. There may be no tomorrow.