Agency Consulting Group, Inc. has been collating composite group results for 37 years. This statistic, alone, is impressive. We have a perspective of how agencies income and expense lines have changed over almost four decades, more than most of us have been in the insurance industry.
For many years we have published our living, growing and changing database once each year in response to our many clients who have wanted to update their comparative analysis of their income and expense averages against those of a much larger group of similar (sized) agencies.
Although we update Gross Profitability Relativity Ratios, Productivity Measures, and Historical Productivity every year, we recognize that YOU can only compare your current position against the recent productivity measures of the database. We have the unique opportunity to look at 37 years of data to establish industry trends.
So we decided to share with you the trends over the long term for agencies in each size group.
Group 1 agencies represent the continuing majority of agencies in the U.S. (despite the “acquisition fever” that continues to grow absorbing selling agencies into larger organizations) under $1 Million of REVENUES (income to the agencies, not Premiums). Last year we expanded this group from $1 Million to $1.5 Million and we see the future need to expand the group once again to $2 Million agencies within the next few years. These are the smaller agencies that still comprise at least 75% of the agencies in the U.S. WE ARE STILL AN INDUSTRY COMPRISED PRIMARILY OF SMALL, LOCALIZED, PROFESSIONAL INSURANCE AGENTS WHO GROW LARGE ENOUGH TO NEED SUPPORT AND AN OFFICE. These agencies tend to perpetuate generationally through family or local mergers with other small agencies. The Group 1 agencies are also the fodder for the mega-agencies who seek out agencies without perpetuation plans to absorb.
Group 2 agencies have broken through the $1.5 Million revenue mark, have 5 to 10 employees with one or two owners who may be the prominent, multi-generational agency in a community.
Many Group 3 agencies were Group 1 or Group 2 agencies that grew through merger or acquisition to achieve $2.5 to $3.5 Million revenue. They may have 15-20 employees and multiple offices and multiple owners. This group is most likely to be Growth (rather than Maintenance or Eroding) agencies.
Some Group 4 agencies legitimately grew to their multi-million status through natural and acquisition growth but a growing number are entrepreneurs, privately owned or corporate-owned with revenues now averaging $9 Million +.
Observations:
Since most agencies are owned and operated by their principal producers, we have identified Gross Profitability as the combination of Executive/Sales compensation plus Pre-Tax Profits. Yes, larger agencies often have non-owner producers. But most Group 1 – 3 agencies are owned by its largest producers. As expected, small agencies earn less gross profit than larger agencies. Over the last five years Gross Profitability has hovered around 37% to 38% while all other groups generate a return between 40% and 43%. Of course, there are additional perqs and benefits that owners retain beyond compensation and pre-tax profits.
Productivity is defined by the gross measure of Revenue/Employee and the refined productivity, SPREAD (the difference between Revenue per Employee and Compensation per Employee).
In the last 20 years, Revenue Per Employee grew as follows:
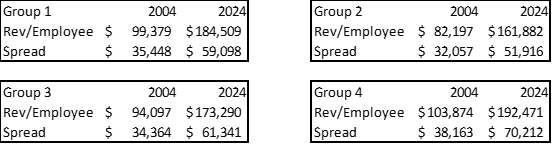
Revenue per Employee almost doubled in each size group of agencies over the last 20 years. This means that we are supporting more customers and policies with fewer employees (the prevalent expense in every agency).
CONTINGENCY RATIO is the comparison of contingent income RECEIVED in the current year vs. total income subject to contingency in the prior year (typically P&C income). This measurement defines the profitability of the agency in question.
Table 1 shows you the current year’s Contingency Ratio for each Composite Group and, more importantly, the 20-year, 15-year and 10-year averages from which you can establish the LIVE TRENDS for each size group.
All four groups are better controlling loss ratios through front-line underwriting of the books of business than they were 20 years ago. Higher contingency ratios indicate more profitable books of business.