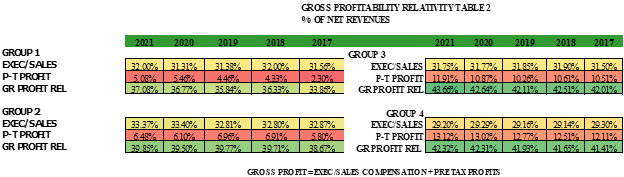
The test of viability of an insurance agency, like most privately held companies, is whether it generated profitability for its owners and whether or not its value grew. The second measure of success is convoluted because value depends on future earnings potential more than historical profitability. A business can lose employees and make more money in any given year but harm themselves irreparably by not having enough qualified people to serve the clients into the future. Less expense spells more profit immediately, but portends lower value in the greater chance of losing customers and revenue without sufficient producers and service agents to retain customers into the future. But the first measure of success remains the potential for profit for the owners of any business. The best measure of profitability is to combine Executive (owner) compensation, perqs and Pre-Tax Profit. We call our measure, Gross Profitability Relativity. We add Executive and Sales Compensation (because, at most agencies, the owners are still the largest producers and can pay themselves for sales and/or for executive duties) to Pre-Tax Profits and compare this Total year-by-year. The Gross Profitability Relativity for all size agencies has risen over the last five years (see Table 2, below). Regardless of the type of business, anyone who can say that their potential benefit for the operation of the business is from 36.77% to 42.64% of the business’ revenue can be proud of the results of their efforts.
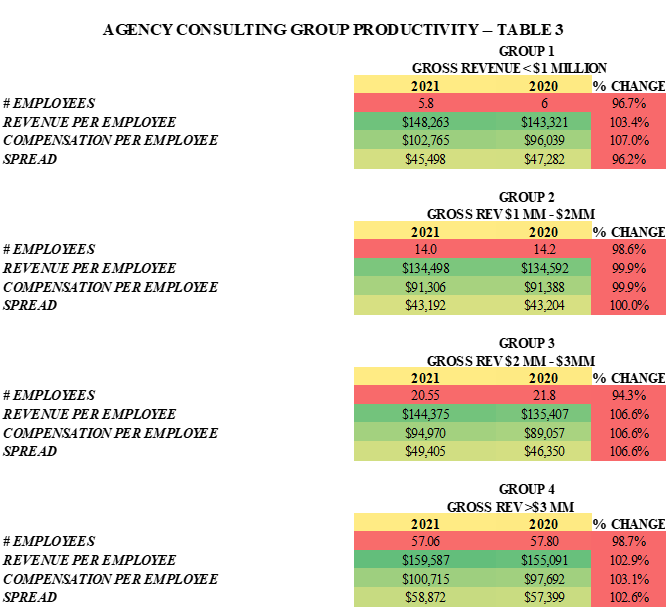
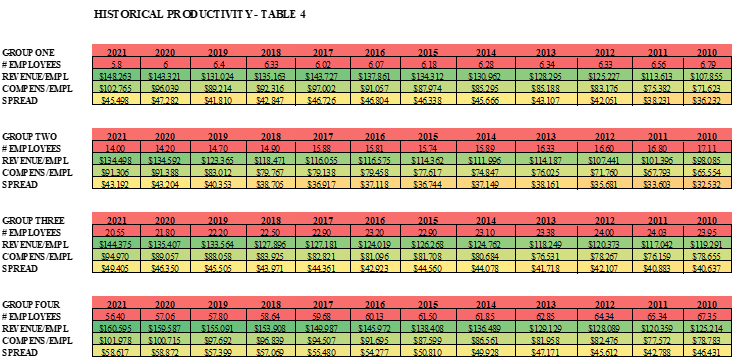
Productivity in its raw form can easily be measured as Revenue per Employee (Total Revenue divided by Total Employees, P-T counting as ½ a FT employee). But in reality, whether you pay high, low or standard for your area, you can’t count employee compensation as part of the productivity of your employees. For instance, if you underpay your employees it looks like they are more productive but it probably costs you emotional stress and the chance of losing people to competition. So we exclude Compensation per Employee from Revenue per Employee (including all benefits and payroll taxes) when judging true agency productivity. The end result is the Spread (Difference between Rev/Empl and Comp/Empl).
The Spread actually grew most in small agencies (Group 1, Under $1 MM and Group 2, $1-$2 Million) last year (primarily because they lost employees and couldn’t find suitable replacements). Larger agencies remained relatively stable or growing 1% in Productivity (see Table 3, below).
LOSS RATIO PROFITABILITY
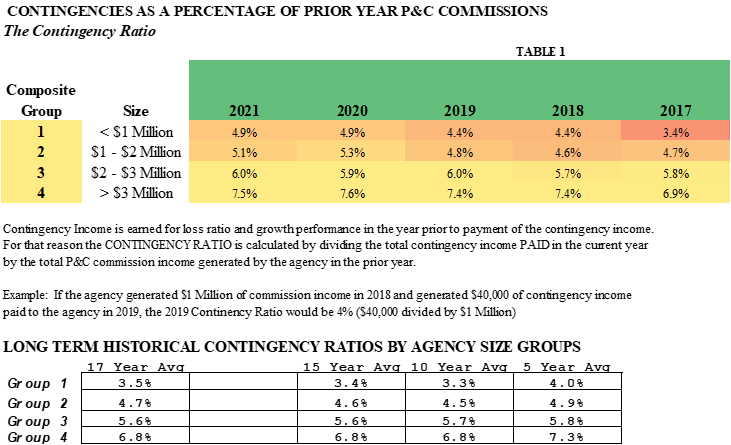
The other notable indicator of healthy agencies is reflected by their loss ratio results as measured by Contingency Income and Contingency Ratio (Current Year Contingency payment vs. Prior Year Commission Income). As reflected in Table 1 (below), every size agency group reflected stronger contingency income as the agencies consolidated their books of business to their favored carriers (or combined through Clusters, mergers or Consolidators to take advantage of the carriers’ best contingency payments). The spread of risk has been helpful and industry loss ratios (outside Cat Losses) have remained stable and affordable with premiums meeting any growth claims costs through inflation.