Some agencies have plenty of cash in hand and feel no stress at month-end in meeting their cash obligations with income and cash-in-hand. Others are stressed every month hoping that the combination of direct bill statements and collected agency bill invoices meets their payroll and other cash obligations.
Regardless of whether you are a cash-rich agency or a cash-poor agency, every agency owner wishes (s)he had a way to project monthly cash in and cash obligations in order to know if and when cash infusion is needed and, if not, whether cash must be left in non-interest bearing bank accounts or can be put to more productive use.
We don’t get many agents asking for Cashflow Projections simply because it takes a bold and brave owner to actually predict if and when a cashflow shortage will occur even though we already know which of our months is traditionally strong and which are weak. Most of us would rather hide our heads in the sand and hope for better results than we expect or have had historically. Then we hound our bookkeepers or keep an eye on the bank account in fear of the worst.
Cashflow CAN be projected. It’s not voodoo or guesswork. It’s a process and if you follow the process every month not only will you be more certain of your cash needs, but you will also build a track record of data that will make the task easier every year.
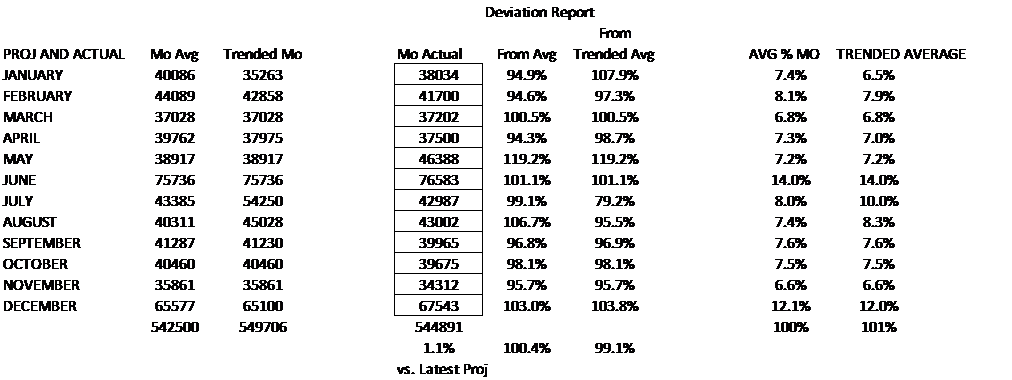
Our cashflow projections are built on historical revenue receipt and historical monthly cash disbursements with agency annual projections of revenue receipts and budgeted expenses acting as the core of future projections. If the revenues are generated as projected, the cashflow projections based on historical performance will be quite close. If either the revenues or the expenses do not achieve the expected levels in the projection period (usually one year), the cashflow projections will be off and the Deviation Report that stems from the on-going analysis will reflect that.
Begin the process by listing on a spreadsheet your income month by month for at least the last three years –the longer the view the more accurate the trending analysis. Calculate the percentage of income generated in each month compared to the entire year as a percentage of the year. When you have done this for the years reviewed you can form the basis of calculating the average percentage of revenue generated in each month. Those trended percentages can be applied to your planned annual revenue for the next year to identify your average expected income per month based on the three or more years studied. You have built the rudiments of an income projection.
If you perform this analysis for at least three years or more, you also have a basis for changing the % Income by Month into a Trended Percentage that reflects the average changed to follow the trends in your agency. Make sure the Trended Percentages total 100% (your averages will automatically total 100%). Trending is more art than science. The more years you have available in front of you the better you can visualize a trend. We include space to physically change the averages to trended expectations when a trend upwards or downwards becomes apparent for a month. The results are measured against the historical average AND the trended average.
I’ve included below displays of our Cashflow Analysis software that we use for our clients for whom we do annual Cashflow Analysis. Our first sample display is the Income Projection for a client agency (with their permission, of course) for whom we do Strategic Planning and Cashflow Analysis.

Included in our analysis are average income per month over three years, projections for the following year based on both average and trended expectations based on their planned revenue changes AND the results for that agency for the projection year in question.
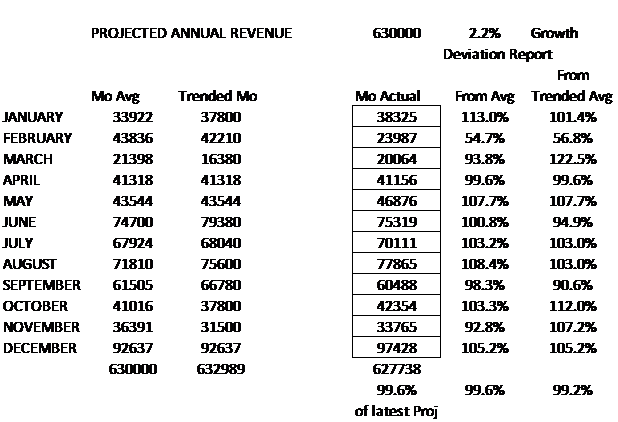
You will notice that the results appear to be very close to the agency’s projections. But you will also notice that the Projections bear a revision date of October, right after the end of the third quarter. The reason for this is that this spreadsheet reflects PROJECTIONS, not budget goals. The budget goals of this agency were for a 4% growth the year. They came in at 1.8%. But this is a Strategic Planning agency. That means that at the end of each quarter, the owners revised the budget projections for revenue and expenses to project as closely as possible the realities of the year from a financial consideration. For some agencies that plan conservatively, they may have to increase their projections based on growth beyond expectations. For this agency, it altered projections downward after the first and second quarter and made a few minor adjustments at the end of the third quarter.
Even without any projection change, this agency’s expected revenue only deviated more than 10% in January (11% deviation due to late billings from December) and February (53% deviation lost a few large accounts). As they made their corrections to identify cashflow projections for the balance of the year, those deviations changed to 13% for January and 57% for February.
The same exercise is done for cash expenses every month. Cash expenses should exclude the non-cash deductible items in your Operating Statement like Depreciation, Amortization and Bad Debts. See the display, below reflecting the three-year expense history of our sample agency including the year’s results.
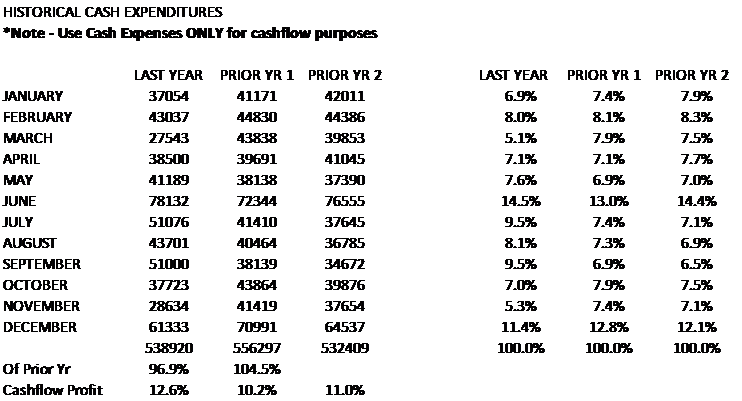
While agency revenues can be relatively accurately projected (by expiration lists and renewal income generated), expenses are much easier to project. There are two types of expenses, regular periodic expenses (like rent, phone, utilities) and singular expenses that are incurred as needed, once a year or unexpectedly. Projecting normal monthly agency expenses is an easy exercise. Projecting singular expenses can be done but are sometimes out of your control. The key to cashflow projections is to schedule all expenses possible toward months with positive cashflow and delay any cash expenses possible from weaker to stronger months.
Cashflow projections tell you when you can afford to purchase equipment or make investments in growth, marketing or advertising and when those expenditures will cause you financial stress and force you to borrow funds to pay your bills. Cashflow projections will show you the months that you are stressed and may influence you to target your NB activities toward those months when possible. The use of a Cashflow Projection program (designed by you in Excel or using our program) will permit you to change expense habits to avoid multiple negative cashflow months and will permit you to shift expenses to those months that your Plan indicates will provide the cash to pay the bills.

We recommend that all planning agencies also create Cashflow Projections and manage them to determine when and if they will be financially stressed by normal or singular expenses. The longer you keep your historical records in this format, the more accurately your projections become. Please call us if you would like to become a Strategic Planning agency or add Cashflow Projections to your management tool belt.